How to Diagnose Touchscreen Issues: A Step-by-Step Guide to Dead Zones, Ghost Touches, and Latency
You swipe a panel and the system registers nothing. You tap a corner and the pointer jumps elsewhere. We have all watched a hardware surface lie about its own input health. Relying on casual finger taps to carry out validation of display integrity is a reliable way to miss deadlines and deliver a broken experience. You need to perform configuration of a systematic diagnostic workflow right away. The Touch Screen Test tool makes it possible to carry out comprehensive hardware verification without pulling out oscilloscopes. We will walk through how to set up necessary permissions, execute live grid sweeps, isolate dead zones, filter out phantom inputs, and measure response latency down to the millisecond. Let us pull back the protective layer.
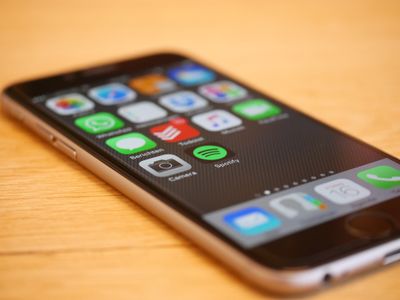
Mapping Coordinate Failures
A dead zone rarely announces itself until a critical interaction fails. Surface residue mimics a hardware defect to a significant extent, which leads to unnecessary component swaps if you skip raw data inspection. The diagnostic utility comes with a coordinate-mapping characteristic that tracks every X and Y pair as you drag across the glass. If a specific quadrant refuses to log contact, you are almost certainly looking at a delamination event inside the digitizer stack. You do not need to speculate about the failure boundary. Perform a slow, continuous sweep across the full test matrix. The rendering layer will highlight unresponsive blocks, which allows you to pinpoint exact coordinate ranges. That precise boundary mapping eliminates guesswork when you carry out decision-making for hardware replacement.
You simply watch the screen while the tool records missing inputs. The grid fills in green when pressure registers. Blank patches stay dark. Those dark patches mark physical breaks in the conductive layer. You can use those exact coordinates to align with manufacturer part guides.
Filtering Phantom Inputs
Ghost touches emerge from nowhere and ruin input predictability. The key driver usually stems from ungrounded capacitance shifts rather than software bugs. You have probably experienced phantom taps while a device plugs into a wall outlet. The diagnostic interface renders those false positives as wandering dots that appear while no skin contacts the glass. That erratic behavior often traces back to compromised electromagnetic shielding. You can leverage a simple isolation step to verify the underlying reason. Disconnect all charging bricks and external peripherals first. Execute a clean run of the touch sequence immediately afterward. If the wandering dots disappear, you successfully filtered out line noise. If the phantom inputs persist, the flex cable routing has likely developed a micro-short that requires physical intervention.
Static electricity also triggers these false signals. Wipe the surface with a microfiber cloth, then run the test again. The diagnostic tool separates intentional pressure from electrical noise, so you stop chasing phantom bugs in your event listeners.
Verifying Concurrent Streams and Response Delay
Gesture-heavy applications collapse under poor concurrent input handling. You cannot validate a modern UI pipeline without checking how the controller handles work for simultaneous contact points. The testing suite provides a multi-touch canvas that tracks independent touch streams in real time. Place two fingers on opposing quadrants. Drag them across the matrix at the same time. The system draws continuous paths for each finger, as well as a separate tracking line for pressure variance. You watch for breaks or line merging. A clean dual-track output confirms the digitizer controller maintains independent sampling channels.
Latency tells the real performance story. You measure the gap between physical contact and visual acknowledgment. The testing module calculates that interval and displays the frame delay in milliseconds. Anything crossing the fifty-millisecond threshold shatters the illusion of direct manipulation. High response delay usually stems from aggressive power management or a bloated compositor queue. You can employ system profiler tools to handle analysis work for those render stalls. Until you drop below that threshold, input responsiveness remains fundamentally compromised.
Permission Setup and Validation Flow
Browser sandboxes block raw pointer event streams by default. You must carry out manual permission assignment to allow the diagnostic tool to read low-level hardware signals. The setup process only takes a few seconds, but skipping it yields zero telemetry. Navigate to the security prompt. Grant access for touch data collection. Once the handshake completes, you can initiate the live calibration sequence. The interface will log every coordinate delta, pressure curve, and timing event. Export those telemetry files and carry out review work for the coordinate heatmaps. That raw export gives you an auditable trail for quality assurance or repair validation.
Do not ignore the baseline calibration step. Screen protectors and manufacturing variances shift the touch threshold. Run the auto-calibration routine first. The tool adjusts the sensitivity curve, which makes the subsequent stress tests well-suited for real-world usage scenarios. Save your results before closing the tab. You will want a reference point when you compare post-repair performance against the original baseline. Build your quality checks in light of those exported logs rather than relying on subjective feel. Hardware diagnostics do not require a lab environment anymore. You just need a methodical workflow, a clean surface, and the willingness to read raw input data instead of trusting marketing specs. Run the test. Log the results. Fix the actual problem.
Ready to test your settings? Just seconds.
Recommended Tools
Mic Tester — #1 Free Online Microphone Test & Recorder
The most trusted free online microphone test. Instantly check your mic for sound quality, echo, and background noise. Real-time waveform visualization, one-click recording, and playback. No install required. 100% private.
Ambient Light Sensor (Lux) Test
Read real-time illuminance data (Lux) from your device's light sensor. Test auto-brightness functionality and monitor surrounding light intensity.
Webcam Test - Check Camera Resolution & Focus
Quickly verify if your webcam is working. Check resolution, focus, and clarity. Supports mirroring and snapshot capture. Essential tool before Zoom/Teams calls.
HDR Display Capability Test
Check if your monitor or mobile screen supports HDR (High Dynamic Range). Visually compare SDR vs. HDR colors and test screen brightness and color depth.
Video Capability Test - 4K/8K Decoding Performance
Analyze your browser and device's video decoding performance. Supports 4K/8K playback testing to identify stuttering, dropped frames, artifacts, and A/V sync issues.
Headphone & Speaker Test - Left/Right Stereo Check
Professional audio output test. Accurately check Left/Right stereo balance, bass response, and distortion on headphones and speakers to ensure optimal sound quality.